
It’s definitely heating up in the Bayous – both in the air and in the water! In July, in Crooked Bayou, air temperature reached 32.2 C (90 F) and water temperature in Bayou Cumbest peaked at 35.6 C (96.8 F) (Fig. 1)!
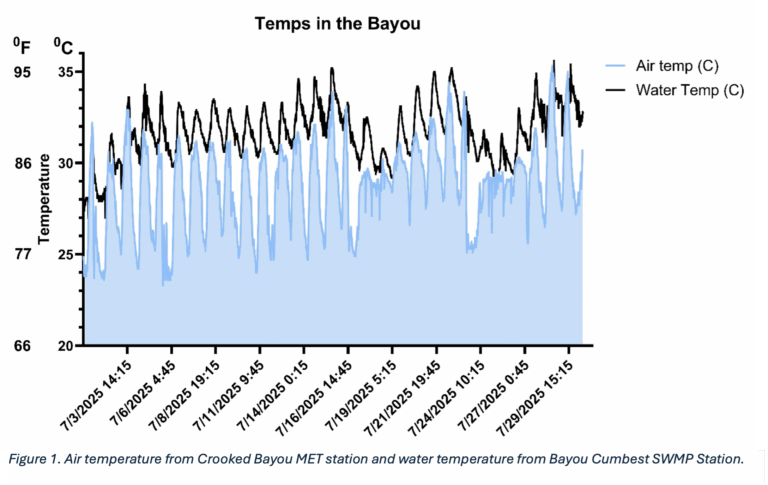
I’m always fascinated when I see data showing how stable water temperature is, compared to air. Water, due to its high specific heat capacity (which is the amount of energy needed to raise the temperature by 1 degree Celsius) holds its temperature relatively well against the more transient changes in air temperature. This attribute of water is such an important one and is responsible for so many aspects of life on earth and the hydrological cycle (don’t get me started on how amazing water is!). The figure above shows this beautifully, even with the fluctuations you get from tidal forces and shallow depths.
Summer rains often mean more run-off. More precipitation combined with whatever may be in the run-off (fertilizers, septic tank and wastewater overflows) can lead to higher total suspended solids (TSS) and chlorophyll-a (Chl-a; a proxy for phytoplankton abundance). TSS can be sediment, plankton, or anything that gets caught on our filter paper, whereas Chl-a specifically reacts to wavelengths in our fluorometer. We saw this increase in TSS and Chl-a during our monthly monitoring, with July having higher amounts of both than in May and June (see Fig. 2 below).
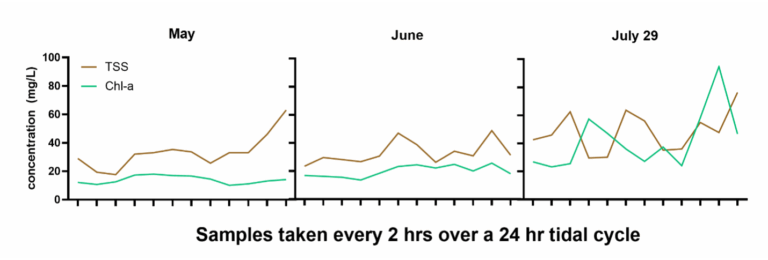
Figure 2. Water samples collected every 2 hrs from Bangs Lake SWMP Station over 24 hrs – across a tidal cycle. Total suspended solids (TSS) and chlorophyll-a (Chl-a) are shown.
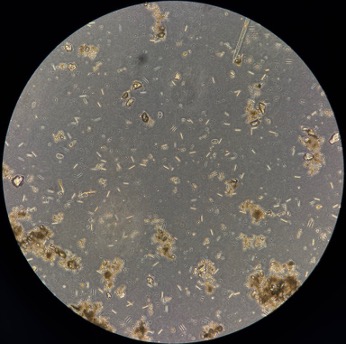
Figure 3. Image of the 100x microscope view of “live” Point Aux Chenes water from July. Thalassionema (the small cylinder-looking diatom) is in ‘bloom’ conditions here, although not in its usual colonial configuration (they look like zigzags when in colonies). Photo by J. Patel.
Although we can’t say why exactly we see this increase in TSS and Chl-a, we can start piecing the puzzle together with other data we collect. For instance, Jeneil (our intrepid phytoplankton identifier!) found a diatom – Thalassionema – in bloom conditions in Point aux Chenes (Fig. 3) and Bangs Lake for July. For a diatom to be ‘blooming’, or found in large numbers, there needs to be an influx of silica, which can often be attributed to run-off of mineral-rich soils and rocks, or possibly from groundwater sources. This leads me to wonder where this silica might be coming from, or what other condition is driving Thalassionema abundance? Oh, the questions we could ask! Diatoms are important as the base of the estuarine food web, as long as they don’t overwhelm the system. One wonderful thing about monitoring this estuary is collecting long-term information on how the estuary functions and how it rebounds (or not) from different, often seasonal, stressors (e.g., high heat).
For all of you out there who monitor our Bayou Heron SWMP station for your current (15 min interval) water quality data, you’ll know that it’s been offline for a few months due to technical difficulties (i.e., equipment failures). The sonde was still collecting data – just not talking with the satellite and ultimately, all you users out there. Well, it’s back up and running now due to our talented and persistent SWMP Manager Cassy Porter! She persevered and got the telemetry (connection to the satellite) working again – just in time to see some startling dissolved oxygen readings (which we’ll talk about next month!). Here’s July in Bayou Heron, in case you missed it (Fig. 4)!
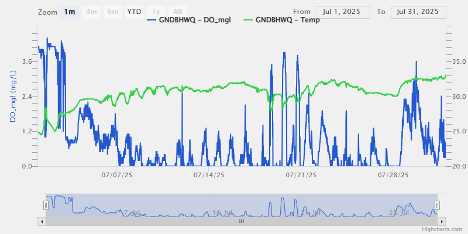
Figure 4. July water temperature (green; degree Celsius) and dissolved oxygen (DO – blue; mg per liter) at the Bayou Heron SWMP Station. Remember, this data is coming from 0.25 m from the bottom and Bayou Heron often stratifies in the summer, which might explain the low DO here.
Even with the heat rising, we still have to get out there and get things done! One team went out to do seagrass surveys around MET Island and Jose Bay with Dr. Patrick Biber from USM. Surveys included “raking” to locate the general areas with seagrass and then running transects (tape measure and goggles!) to estimate cover. It was hot, so when they were done, they took a moment to “cool off” in the warm waters of the Sound (Fig. 5).
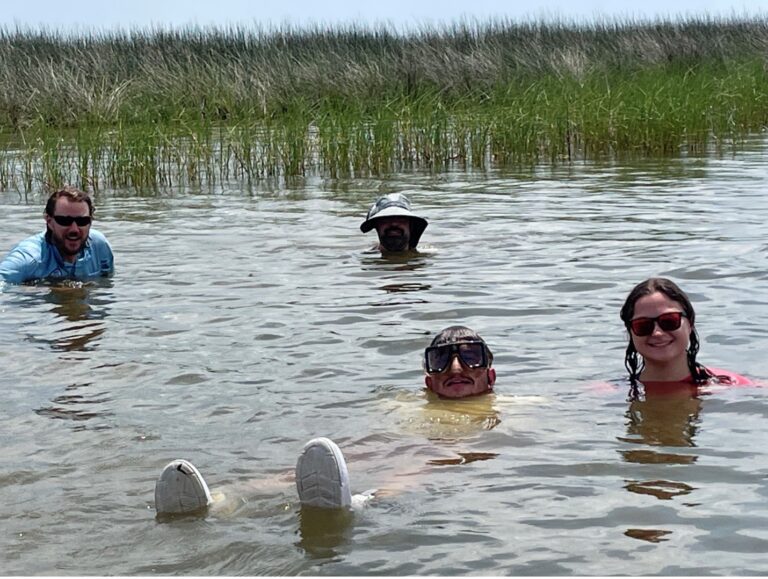
Figure 5. Seagrass survey team taking a moment to cool down and smile for the camera. Photo by J. McIlwain.
We also said goodbye to our Hollings Scholars (see last month’s post and Fig. 6). They were here for 9 weeks and what a whirlwind of activity – from catching oyster drills, keeping them alive in tanks and running experiments, collecting plankton samples and counting counting counting, and running GIS models from years’ worth of field-collected (think – boots on the ground) and drone surveyed data. This place was buzzing with activity, even though our summer months are usually a bit quieter. We’ll miss having them around but look forward to seeing where their next adventures take them!
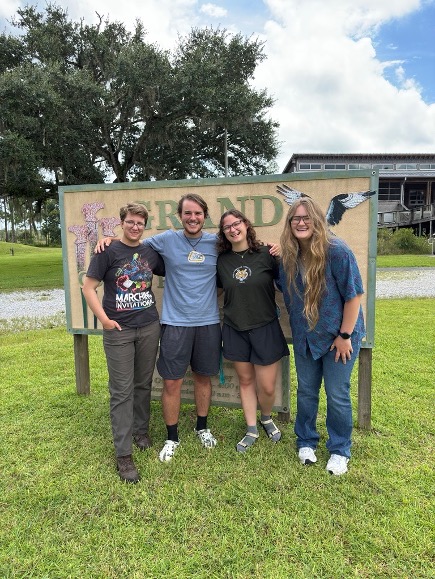
Figure 6. Summer 2025 Hollings Scholars and DMR Intern (from left: Coen McGarrah, Justin Osborne, Jessica Yesensky, and Alexis Gentry – DMR). Photo by J. Patel.